I got a lot of questions about using Application Insights when I was working as Microsoft Consultant, from customer has no exposure to application monitoring to customer wants to boil the ocean on day one. This One-Pager captures the usage of Application Insights for .NET application that you should implement on day one.
Capture Telemetry
For any .NET core application that is deploying into Azure App Service or Azure Functions, Auto-Instrumentation is enabled out of the box once a connection string is provided in the App Settings, and Application Insights SDK is not required. For Azure App Service, a couple more settings are required:
    appSettings: [
      {
        name: 'APPLICATIONINSIGHTS_CONNECTION_STRING'
        value: '<your-app-insights-connection-string>'
      }
      {
        name: 'ApplicationInsightsAgent_EXTENSION_VERSION'
        value: '~3' // use ~3 for Linux, ~2 for Windows
      }
      {
        name: 'XDT_MicrosoftApplicationInsights_Mode'
        value: 'recommended' // used for .NET Core, ignored for other runtimes
      }
    ]
Note: Instrumentation key ingestion should be avoided since it will be retired in March 2025.
Application Insights collects telemetries for Request, Exception and Dependency, then correlates them presents the result in the Azure Portal with pre-aggerated metrics such as average, count. Basically, you should have enough information to analyze your application performance and troubleshoot most of the errors. If additional application information is required, utilize the default configuration of ILogger, which collects Warning logs and more severe logs into Application Insights.
        [HttpGet]
        public async Task<IEnumerable<Stock>> Get()
        {
            // Demo call Api
            await _weatherApi.GetForecastAsync();
            // Demo call Sql
            var result = await _stockSvc.GetAsync();
            // Demo call Api again
            await _weatherApi.GetForecastAsync();

            _logger.LogInformation("**log** Informational in api controller");
            return result;
        }

        [HttpGet]
        [Route("Error")]
        public Task<IEnumerable<Stock>> GetError()
        {
            _logger.LogWarning("Warning Logged.");
            throw new Exception("Demo application exception with log message");
        }
Analyze Telemetry
Once the telemetry is captured, Application Insights provides different ways to view, analyze and use the result. I would recommend starting with these 3 views in Azure Portal: Failure, Performance and Live Metrics. In addition, if you need to locate your custom logging quickly, perform a search under Transaction search (MS Doc link) view.
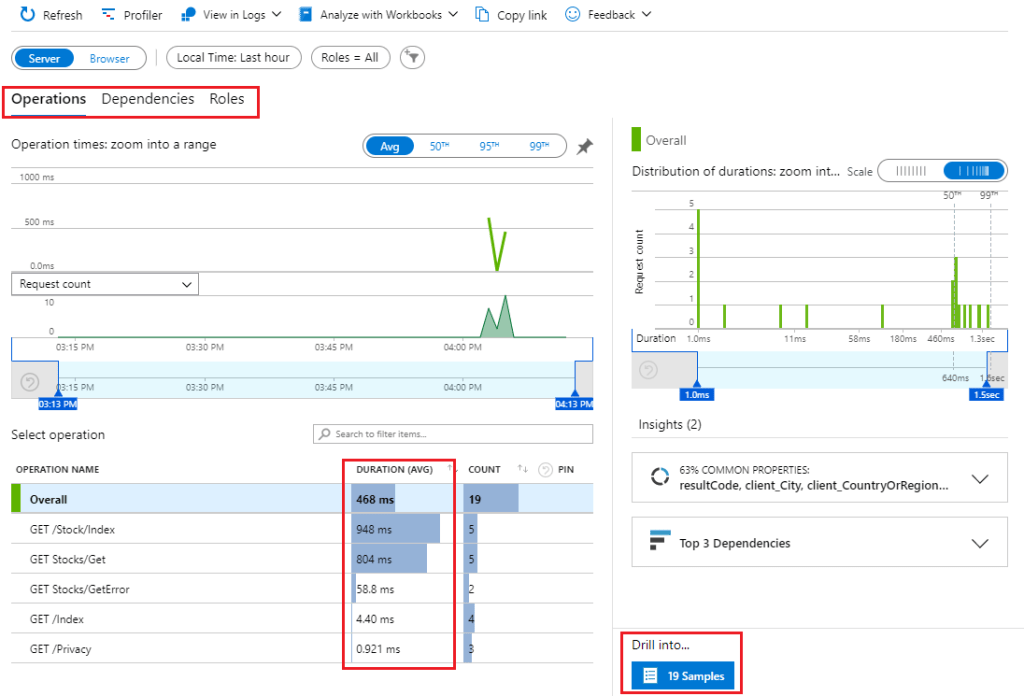
Performance View
Use the Performance view to determine if there is any improvement or bottleneck in your application, you can see the requests are grouped and sorted by average duration, and you can click on the individual row, then drill down the request.
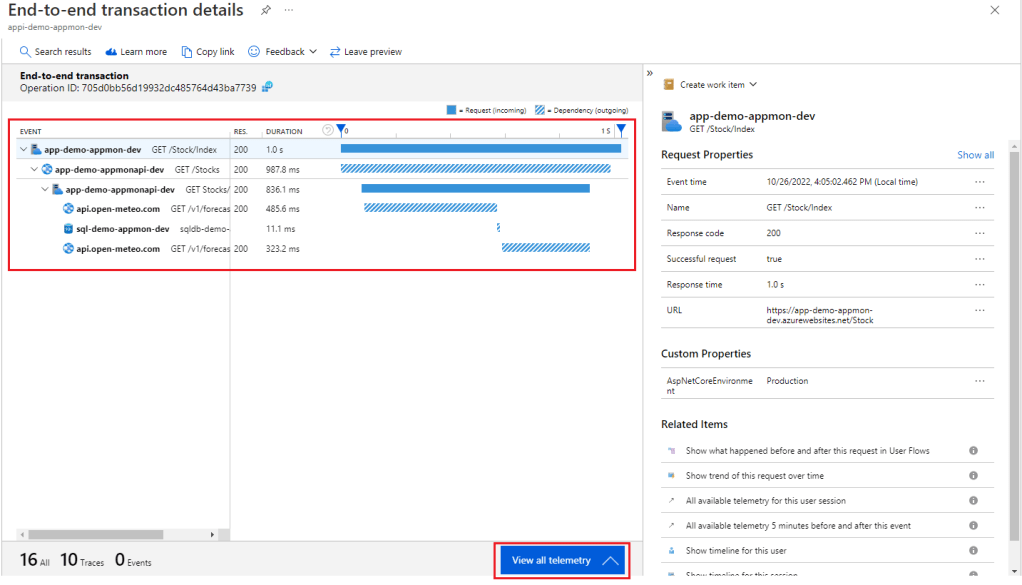
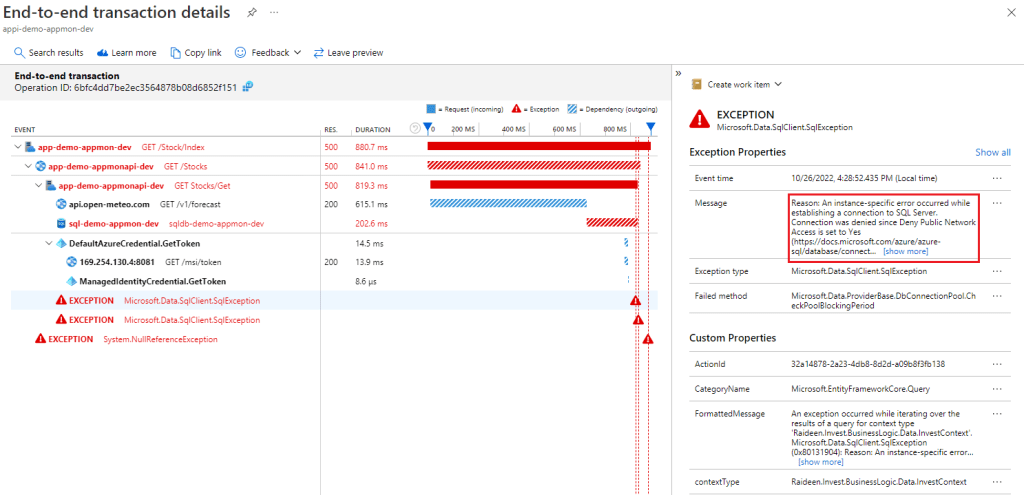
Once drilled down, you can see the end-to-end transaction (similar to call stack) with a time dimension, which provides visibility into one single transaction/request. It is excellent tool to find the root cause of reliability issues and performance bottlenecks. You can also click on the [View all telemetry] button to see all the records.
Failure View
The Failure view shows all the exception captured and based on Operations, Dependencies or Exceptions with Top 3 grouping. You can drill down into the details by clicking on the hyperlink under the COUNT column.
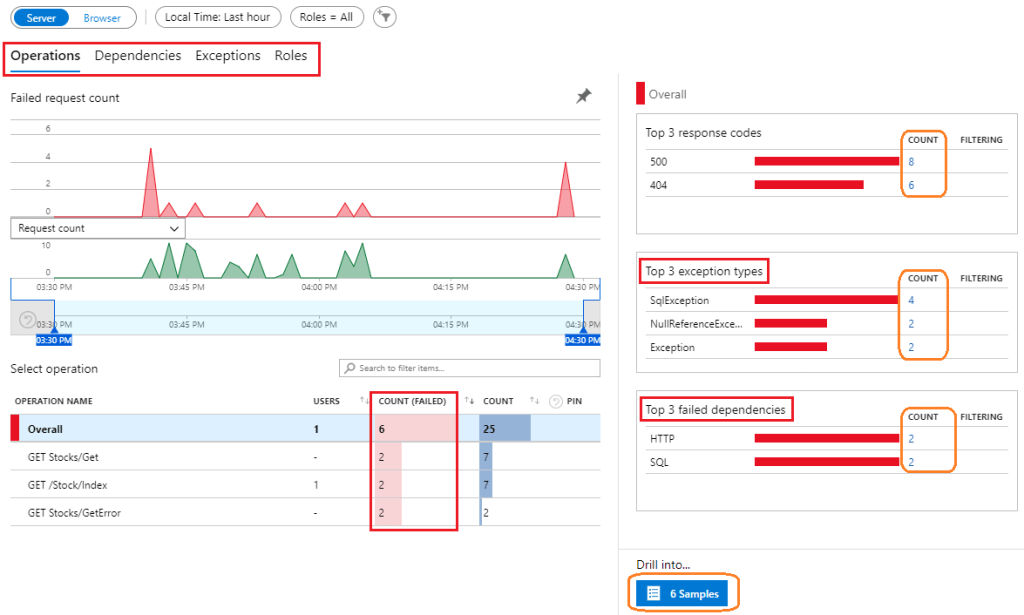
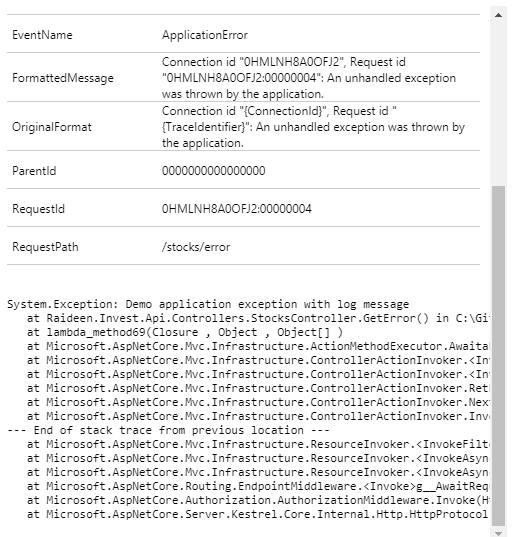
For troubleshooting, I would suggest and [Samples] button and click on one of the samples to view the end-to-end transaction with the exceptions. You may need to go through each exception to determine the root cause of the problem. In the example below, even though the top level is Null Reference Exception, but the root cause is no access to the SQL server:
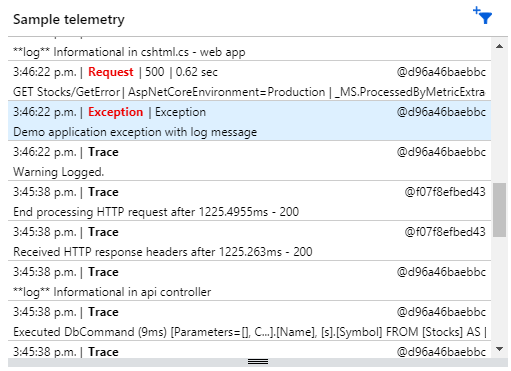
Live Metrics View
In Application Insights, the latency of collecting/sending data is about 60 seconds. By using Live Metrics view, the latency is 1 second and it covers both performance and failure information plus custom logging entry, so I found this view is useful for these 3 scenarios:
- Perform ‘real-time’ troubleshooting in your dev/test environment
- Monitor results from performance validation test
- Monitor production environment for critical release

Similar to other two views, you can click on the telemetry to drill down for the details:
IMPORTANT: When Live Metrics is being used, telemetry is displayed within one second with no retention, which mean you won’t find them anymore once the Live Metrics is closed. You should close the browser window to ensure Live Metrics is shut down so that all telemetries are now stored in to Log Analytics.
Closing up
This is 80/20 rule, this one pager shows how to utilize Auto Instrumentation to fulfill 80% real world usage scenarios out of Application Insights with 20% of effort. Personally, I would suggest avoiding using Application Insights SDK on day one, it is nothing bad but just one less item you need to worry if you don’t need it. I can see a couple of situations that SDK is required, and I will let you explore them with the provided links:
- Auto Instrumentation is not available, see the Supported Environment (MS Doc link)
- Custom events and metrics are required, see Microsoft Documentation (MS Dock link)
You may also want to check out the Application Maps view as well as the tutorials listed below.
